The Advance Of Cane Toads In Australia

The advance of cane toads in Australia
More Posts from Envirographs and Others

The annual energy potential of renewable versus nonrenewable energy sources


Wetlands losses and gains for different land use categories. While, historically, agriculture was responsible for the vast majority of wetlands losses, government incentive programs like the Wetlands Reserve Program have encouraged farmers to restore former wetlands on their lands, contributing to a net gain of wetlands from the agriculture sector 2004-2009. In contrast, silviculture (forestry) is contributing heavily to wetlands losses, with urban and rural development also destroying wetlands. Urban and rural development combined accounted for 23 percent of the wetland losses 2004-2009, while silviculture accounted for 56% (a decrease from 1998-2004 for urban and rural development and an increase for silviculture).
*"Other" included areas such as native prairie, un-managed forests, scrub lands, barren and abandoned land, lands enrolled in conservation easements or other lands designated as wildlife management areas. Conservation programs are largely responsible for high wetlands gains from these areas.

Everglades (and south Florida, including Miami) with 2ft of sea level rise

Land use change on Cape Cod. This image shows a dramatic increase in development on the Cape from the 1950s into the twenty-first century. This is problemmatic, as the increased development leads to loss of native habitats and an increase in water pollution. The latter is largely a result of the fact that very little development is connected to sewers, and nitrogen from septic systems quickly leaches through the sandy soils into ponds, streams and bays.
Further, development is threatened by climate change; specifically sea level rise and increased costal erosion .
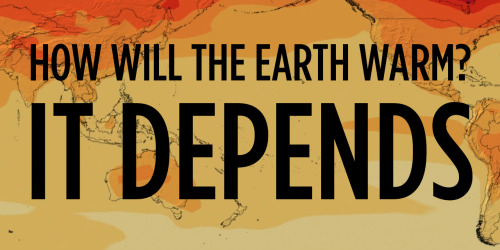


As governments discuss climate change in Paris, they’ll be referring to the dire predictions of climate scientists. Here are three visualizations of possible futures based on detailed climate models and summed up by the United Nations’ Intergovernmental Panel on Climate Change (IPCC) in their 2013 report. The deeper the red - the hotter things are getting.
The message is clear: we better act fast.
How did they come up with these models? Read or listen to Nell Greenfieldboyce’s story.
Image Credit: NASA’s Scientific Visualization Studio and NASA Center for Climate Simulation

The Berkeley Earth Surface Temperature study just released an analysis of land-surface temperature records going back 250 years, about 100 years further than previous studies. The analysis shows that the rise in average world land temperature was approximately 1.5 degrees C in the past 250 years, and about 0.9 degrees in the past 50 years. This graph displays decadal average land surface temperatures reported from multiple sources.

From National Geographic:
Four national monuments in the American West could be shrunk and six others opened up to permit more mining, grazing, logging, and commercial fishing if President Trump follows the recommendations of Interior Secretary Ryan Zinke...
If enacted, the modifications would represent the most sweeping changes to existing national monuments by any sitting president — and are sure to set off a legal battle over presidential powers likely to reach the U.S. Supreme Court.
Here are the threatened monuments:
Facing size reduction: 4. Cascade-Siskiyou, Oregon/California 12. Gold Butte, Nevada 13. Grand Staircase Escalante, Utah 14. Bears Ears, Utah
Facing management changes (mining, grazing, logging, fishing): 20. Organ Mountains-Desert Peaks, New Mexico 21. Rio Grande del Norte, New Mexico 22. Katahdin Woods and Waters, Maine C. Pacific Remote Islands, south of Hawaii D. Rose Atoll, by American Samoa E. Northeast Canyons and Seamounts, off the coast of Massahcusetts

The reduction in CO2 emissions from the energy sector in the U.S. over the past 5 years (see previous post) was due in large part to a reduction in emissions from coal. In 2009, the financial collapse led to diminished use of all fuel sources and greenhouse gas reductions across the board. Since then, the expanding use of natural gas has increased it's carbon footprint, but the decline in the use of coal and the subsequent decrease in greenhouse gas emissions associated with coal is remarkable. Coal is the most carbon-rich fossil fuel, so any declines from that source is good news for the climate.

The eclipse fingerprint on solar panels in Missoula, MT.
Source: https://twitter.com/mfrank406/status/899986864303611905
-
 etoshitoshi liked this · 8 years ago
 -
 lucernesworld liked this · 8 years ago
 -
 bigbizlizwiz liked this · 8 years ago
 -
 thatguywiththatblog liked this · 8 years ago
 -
 fireleaptfromhousetohouse reblogged this · 8 years ago
 -
 climate-changing liked this · 8 years ago
 -
 gumby713 reblogged this · 8 years ago
 -
gumby713 liked this · 8 years ago
-
 phenoct liked this · 8 years ago
 -
 sinister-magic liked this · 8 years ago
 -
 confusedbyinterface reblogged this · 8 years ago
 -
 kitstacean liked this · 8 years ago
 -
 shacklesburst liked this · 8 years ago
 -
 argumate liked this · 8 years ago
 -
argumate reblogged this · 8 years ago
-
 kitswulf reblogged this · 8 years ago
 -
 itstimewehavesomesoliddick liked this · 8 years ago
 -
 mcm-curiosity liked this · 8 years ago
 -
 spacetimewithstuartgary reblogged this · 8 years ago
 -
 sharkyshon2 liked this · 8 years ago
 -
 helix-eagle-hourglass-nebula reblogged this · 8 years ago
 -
 kowogueka liked this · 8 years ago
 -
 suzer1 liked this · 8 years ago
 -
 itsathought2 liked this · 8 years ago
 -
 lemurpalace liked this · 8 years ago
 -
 envirographs reblogged this · 8 years ago
 -
 1337wizard reblogged this · 8 years ago
 -
kitswulf liked this · 8 years ago
-
 your-face-has-a-shell-on-it liked this · 8 years ago
 -
 lordtableshark liked this · 8 years ago
 -
 masteroflights liked this · 8 years ago
 -
 the-space-trashcan liked this · 8 years ago
 -
 beefyclementine liked this · 8 years ago
 -
 dendroica liked this · 8 years ago
 -
 daydreams-and-honeybees liked this · 8 years ago
 -
 iliketrains458 liked this · 8 years ago
 -
 maptitude1 reblogged this · 8 years ago
A visual exploration of environmental problems, movements and solutions.
151 posts