The Government Owns A Whole Lot Of Land In The Western United States. The Resulting Conflict Between

The government owns a whole lot of land in the western United States. The resulting conflict between the government and environmentalists seeking to conserve this land for multiple use (parks, ranching, logging, mining, forestry, wildlife preservation, recreation etc.), and the Wise Use movement seeking to transfer the land from the government to the states or to private ownership, is a hallmark environmental fight in the west that many in the eastern United States are unaware. And it drives these standoffs that we saw in Nevada (Cliven Bundy) and now Oregon.
More Posts from Envirographs and Others

Predicted land change along the Louisiana coast over the next 50 years if we do nothing more than we have done to date. Red indicates areas likely to be lost, and green indicates areas of new land. This map is based on assumptions about increases in sea level rise, subsidence, and other factors.
The global rise in mean sea level is complicated in the Mississippi River Delta region by subsidence (sinking land). The Gulf of Mexico has one of the highest rates of subsidence in the nation due to sediment compaction and the extraction of groundwater, oil and natural gas. Restoration of the deltaic system can help stabilize shorelines and reduce the associated risks with rising sea levels. Deltas are formed by the constant inflow of sediment from rivers. However, the Mississippi River Delta has been cut off from this natural process through the construction of extensive levee systems for navigation and flood protection. Through planned sediment diversions, the natural deltaic process can be restored and help increase the resiliency of coastal areas.
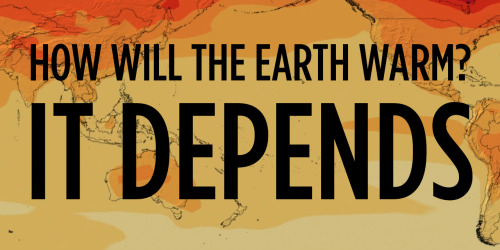

As governments discuss climate change in Paris, they’ll be referring to the dire predictions of climate scientists. Here are three visualizations of possible futures based on detailed climate models and summed up by the United Nations’ Intergovernmental Panel on Climate Change (IPCC) in their 2013 report. The deeper the red - the hotter things are getting.
The message is clear: we better act fast.
How did they come up with these models? Read or listen to Nell Greenfieldboyce’s story.
Image Credit: NASA’s Scientific Visualization Studio and NASA Center for Climate Simulation

Even as global carbon dioxide emissions hit a record high in 2012, CO2 emissions from energy generation in the United States fell to 1994 levels. This is a 13% decrease over the past 5 years. President Barack Obama has set a climate goal of lowering greenhouse gas emissions 17% from 2005 levels over the next decade. By the end of last year, levels were down 10.7% from the 2005 baseline, meaning America is more than halfway towards that goal.
The reductions come from a variety of places. It is, in part, because of new energy-saving technologies. In part because of a weakened economy. In part because of a growing share of renewables in the energy sector. And in part because cleaner natural gas is displacing carbon-rich coal.
While this is good news, there are some important caveats. 1.) This is only the U.S. Emissions are rising rapidly in other parts of the world. 2.) This is only CO2 emissions from energy production. This is a big source of greenhouse gas emissions, but not the only one. 3.) This rate of decline is probably not fast enough to avert the worst of climate change.

Conservation status of reptiles, which include snakes, lizards, turtles & tortoises, tuataras and the crocodilians

The most recent Living Planet Report (May 2012), compiled by the Zoological Society of London, examined more species (2,600) and more populations of those species (9,014) than ever before. Overall, these populations show a decline of about 30% since 1970. Tropical species (light green) show a decline of more than 60%, while in temperate regions (dark green) there has been an average recovery of about 30%. The worst affected species are those in tropical lakes and rivers, whose numbers have fallen by 70% since 1970.

California's climate change law (AB 32), which puts a price on carbon emissions and creates a cap-and-trade system to reduce greenhouse gas emissions, is yielding substantial reductions in emissions from oil refineries. These refineries are a major source of carbon emissions, along with a host of other toxic chemicals like ammonia, lead, benzene, mercury and acid gases.
Data from the California Air Resources Board shows that 11 refineries substantially reduced emissions between 2010 and 2011, in addition to cuts in the release of other toxic pollutants. Evidence shows that these reductions not a result of cuts in production, but to refineries investing in and upgrading equipment in response to AB 32. An example is Valero’s refinery in Benicia, CA, which decreased covered emissions by over 95,000 metric tons, while also cutting ammonia emissions by 98%, sulfuric acid by 84%, and benzene by 49%, through the installation of a new flue gas scrubber.

The species groups that are proportionally most in danger (the proportion of species within that grouping that are imperiled) are overwhelmingly freshwater species. Freshwater mussels, crayfishes, stoneflies (stonefly larvae live in freshwater), freshwater fishes and amphibians are the most at risk. This demonstrates the substantial need for a focus on conservation of freshwater habitats.


Direct and indirect employment, as of 2013-2014, in the global renewable energy industry.

Avg. daily precipitation in the U.S. over the course of a year
Source: MetricMaps

Extent of surface melt over Greenland’s ice sheet on July 8 (left) and July 12 (right). Measurements from three satellites showed that on July 8, about 40 percent of the ice sheet had undergone thawing at or near the surface. In just a few days, the melting had dramatically accelerated and an estimated 97 percent of the ice sheet surface had thawed by July 12.
On average in the summer, about half of the surface of Greenland's ice sheet naturally melts. But this year the extent of ice melting at or near the surface jumped dramatically. According to satellite data, an estimated 97 percent of the ice sheet surface thawed at some point in mid-July, a larger area than at any time in more than 30 years of satellite observations. This extreme melt event coincided with an unusually strong ridge of warm air, or a heat dome, over Greenland. The ridge was one of a series that has dominated Greenland's weather since the end of May
-
 hersundaybest reblogged this · 9 years ago
 -
hersundaybest liked this · 9 years ago
-
 josh-shrug-emoji reblogged this · 9 years ago
 -
 envirographs reblogged this · 9 years ago
A visual exploration of environmental problems, movements and solutions.
151 posts